A-level Physics Year 13 · Topic 13
Stellar evolution
Stellar evolution is the life story of a star, from a cloud of gas to its final remnant.
We will read the Hertzsprung Russell diagram and see how fusion keeps a main sequence star in balance.
Then we follow low-mass stars to white dwarfs, and massive stars to supernovae, neutron stars and black holes.
- 5 subtopics
- 151 questions
- Free: 13.1 notes and 10 questions
In this topic
- 13.1The Hertzsprung–Russell diagramFree below · 25 questions
- 13.2Star formation, fusion and equilibrium on the main sequenceOpen in Full Marks · 62 questions
- 13.3Red giants, planetary nebulae and white dwarfsOpen in Full Marks · 18 questions
- 13.4Supernovae, neutron stars and the Chandrasekhar limitOpen in Full Marks · 28 questions
- 13.5Black holes, event horizon and Schwarzschild radiusOpen in Full Marks · 18 questions
13.1 · Free notes
The Hertzsprung–Russell diagram
Key points
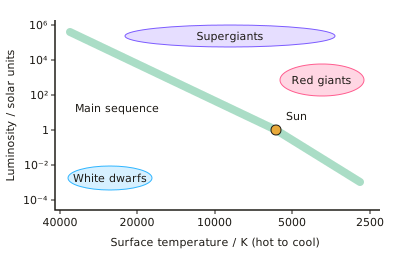
- The Hertzsprung–Russell (HR) diagram plots luminosity (or absolute magnitude) against surface temperature (or spectral class). Temperature is plotted on a logarithmic axis that decreases left to right, which is a common exam trap.
- The main sequence is a diagonal band from hot, luminous stars (top left) to cool, dim stars (bottom right). About 90% of stars lie on it, and all of them are fusing hydrogen to helium in their cores. The Sun is on it (L = 3.8×10²⁶ W, T ≈ 5800 K).
- Red giants (top right) are cool (about 3000–5000 K) but very luminous, so they must have a very large radius. Supergiants lie along the top, and white dwarfs (bottom left) are hot but dim, so they have a very small radius.
- The Stefan–Boltzmann law for a black body is L = 4πr²σT⁴, with σ = 5.67×10⁻⁸ W m⁻² K⁻⁴. To compare two stars, L₁/L₂ = (r₁/r₂)²(T₁/T₂)⁴. Doubling T at constant radius increases L by 16 times.
- Wien's displacement law: λmax T = 2.898×10⁻³ m K. A hotter star has a shorter peak wavelength and looks bluer. Use it to find T from a measured λmax, then use the Stefan–Boltzmann law to find r.
- Spectral classes in order of decreasing temperature are O B A F G K M (O is blue and above about 30 000 K, M is red and below about 3500 K). Absorption-line strengths depend on temperature. Balmer hydrogen lines are strongest in A stars (about 10 000 K) because excited n = 2 atoms are most abundant at that temperature.
- Absolute magnitude M is the apparent magnitude a star would have at 10 pc. m − M = 5 log(d/10), with d in parsecs. A smaller or more negative magnitude means a brighter star.
- A star's position on the main sequence is set by its mass. More massive main-sequence stars are hotter, more luminous and larger. Lines of constant radius run diagonally across the diagram, with larger radii towards the top right.
- As a star evolves it moves across the HR diagram. A Sun-like star leaves the main sequence, moves to the red-giant region (top right), then crosses to the white-dwarf region (bottom left).
- In exam answers, link position to physical properties. Top right means large radius, bottom left means small radius, and the same temperature with a lower luminosity means a smaller surface area.
In more detail
- Axes: luminosity (log scale, in solar units) up the y-axis; surface temperature along the x-axis, decreasing to the right, roughly 40 000 K to 2500 K.
- Worked giant radius: L = 100 L☉ and T = 4000 K (Sun 5800 K) → r ÷ r☉ = √100 × (5800 ÷ 4000)² = 10 × 2.10 ≈ 21 solar radii.
- Worked white dwarf radius: L = 0.01 L☉ and T = 10 000 K → r ÷ r☉ = 0.1 × (0.58)² = 0.034, about 2.3 × 10⁷ m, only a few times Earth's size.
- Population: about 90% of stars are on the main sequence, because stars spend most of their lives fusing hydrogen in their cores.
Practice
The Hertzsprung–Russell diagram: 10 questions
Pick an answer to check it, or open the answer for the explanation.
1. On a standard Hertzsprung–Russell diagram, how are the axes arranged?
- Luminosity upwards; temperature increasing to the right
- Luminosity upwards; temperature decreasing to the right
- Luminosity upwards; temperature increasing to the left only on a linear scale
- Temperature upwards; luminosity decreasing to the right
Show answer
B: Luminosity upwards; temperature decreasing to the right. Luminosity is on the vertical axis. Temperature runs from hot on the left to cool on the right, so it decreases along the axis. This is the conventional arrangement.
2. A star lies in the top-right corner of an HR diagram. What can be deduced about it?
- It is a main-sequence star
- It has a very high surface temperature
- It is very small and dense
- It has a very large radius
Show answer
D: It has a very large radius. Top right means cool but very luminous. Since L = 4πr²σT⁴, a low T with a high L requires a very large surface area, so it is a red giant or supergiant.
3. A star's spectrum peaks at 4.8×10⁻⁷ m. Using λmax T = 2.898×10⁻³ m K, what is its surface temperature?
- 6.0×10³ K
- 1.4×10⁻⁹ K
- 1.7×10⁴ K
- 3.0×10² K
Show answer
A: 6.0×10³ K. T = 2.898×10⁻³ / 4.8×10⁻⁷ = 6.0×10³ K. Multiplying the two numbers instead of dividing gives the wrong answer of 1.4×10⁻⁹.
4. Stars A and B have the same surface temperature. A is 100 times more luminous than B. What is the ratio of radius A to radius B?
- 4
- 1000
- 100
- 10
Show answer
D: 10. At the same T, L ∝ r². So r_A/r_B = √100 = 10.
5. A star's radius stays constant while its surface temperature doubles. By what factor does its luminosity change?
- ×2
- ×4
- ×8
- ×16
Show answer
D: ×16. L = 4πr²σT⁴, so L ∝ T⁴. Doubling T gives 2⁴ = 16 times the luminosity.
6. A white dwarf at 12 000 K is far less luminous than a main-sequence star at 12 000 K. What is the reason?
- The white dwarf emits only infrared
- The white dwarf is cooler in its core
- The white dwarf has a lower mass
- The white dwarf has a much smaller surface area
Show answer
D: The white dwarf has a much smaller surface area. At the same T, power per unit area is the same (σT⁴). The lower luminosity must come from a much smaller radius, so a smaller surface area.
7. Which list gives spectral classes in order of decreasing surface temperature?
- O, B, A, F, G, K, M
- M, K, G, F, A, B, O
- A, B, O, F, G, K, M
- O, A, B, F, G, M, K
Show answer
A: O, B, A, F, G, K, M. The sequence O B A F G K M runs from the hottest (blue) to the coolest (red) stars.
8. Use m − M = 5 log(d/10), d in pc. A star has apparent magnitude +3.0 and is 100 pc away. What is its absolute magnitude?
- −7.0
- +8.0
- −2.0
- +3.0
Show answer
C: −2.0. M = m − 5 log(100/10) = 3.0 − 5 = −2.0. The star would be brighter at 10 pc, so M is lower than m.
9. Which statement about main-sequence stars is correct?
- Main-sequence stars have used up their core hydrogen
- All main-sequence stars have the same luminosity
- More massive stars are cooler but more luminous
- More massive stars are hotter and more luminous
Show answer
D: More massive stars are hotter and more luminous. Mass determines position along the main sequence. High-mass stars lie at the top left: hot, blue and very luminous. All of them fuse hydrogen in their cores.
10. A star has surface temperature 3500 K and luminosity 200 times the Sun's. Where does it lie on the HR diagram?
- Blue supergiant region
- Red giant region
- White dwarf region
- Lower end of main sequence
Show answer
B: Red giant region. A cool, red star that is much more luminous than the Sun must have a large radius, so it is a red giant.
Keep going in Full Marks
Full Marks has 25 questions on The Hertzsprung–Russell diagram (15 more than here), set out in practice levels. You also get notes and 3D models for all 5 subtopics of Stellar evolution, plus games, timed exams and past papers.
On your exam board
- AQATopic 9: Option: Astrophysics
- OCR ATopic 5.5: Astrophysics and cosmology
- OCR BTopic 5.3: Our place in the universe
- EdexcelTopic 10: Space
Not in the Cambridge specification.