A-level Maths Year 13 · Topic 7
Statistics
Statistics at A2 level introduces the normal distribution and more powerful hypothesis tests.
We will use conditional probability with Venn diagrams, tree diagrams and tables, and calculate normal probabilities.
Then we find unknown means and standard deviations, approximate the binomial with the normal, test correlation and means, and work with the large data set.
- 11 subtopics
- 710 questions
- Free: 7.1 notes and 10 questions
In this topic
- 7.1Conditional probability and the normal distributionFree below · 80 questions
- 7.2Hypothesis testing with correlation and the normal distributionOpen in Full Marks · 75 questions
- 7.3Venn diagrams, tree diagrams and two-way tables for conditional probabilityOpen in Full Marks · 76 questions
- 7.4Inverse normal and finding an unknown mean or standard deviationOpen in Full Marks · 72 questions
- 7.5Normal approximation to the binomial distributionOpen in Full Marks · 58 questions
- 7.6Hypothesis test for the mean of a normal distributionOpen in Full Marks · 81 questions
- 7.7Working with the large data setOpen in Full Marks · 74 questions
- 7.8The Poisson distribution: conditions, probabilities and approximationsOpen in Full Marks · 53 questions
- 7.9Linear combinations of random variables: expectation, variance and sums of normal variablesOpen in Full Marks · 31 questions
- 7.10Continuous random variables: probability density functions, median, mean and varianceOpen in Full Marks · 53 questions
- 7.11Sampling and estimation: unbiased estimates, the central limit theorem and confidence intervalsOpen in Full Marks · 57 questions
7.1 · Free notes
Conditional probability and the normal distribution
Key points
- Conditional probability: P(A|B) = P(A ∩ B) ÷ P(B). Events are independent if P(A|B) = P(A).
- Venn diagrams and tree diagrams help model conditional situations.
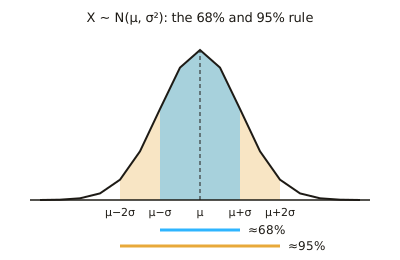
- The normal distribution X ~ N(μ, σ²) is symmetrical about the mean, with about 68% of data within 1 standard deviation and 95% within 2.
- Standardising uses Z = (X − μ) ÷ σ to convert to the standard normal distribution.
- A binomial distribution can be approximated by a normal distribution when n is large and p is close to 0.5.
In more detail
- Worked standardising: X ~ N(50, 16) → σ = 4 → P(X < 56) = P(Z < 1.5) = 0.9332.
- Worked interval: P(46 < X < 54) = P(−1 < Z < 1) = 0.6827.
- Worked rule of thumb: about 95% of values lie within μ ± 2σ, here 42 to 58.
- Worked conditional: P(X > 54 | X > 50) = P(X > 54) ÷ P(X > 50) = 0.1587 ÷ 0.5 = 0.317.
- Worked approximation: B(100, 0.5) can be approximated by N(50, 25).
Practice
Conditional probability and the normal distribution: 10 questions
Pick an answer to check it, or open the answer for the explanation.
1. What does P(A|B) mean?
- The probability of A and B
- The probability of A given B has occurred
- The probability of A or B
- The probability of neither
Show answer
B: The probability of A given B has occurred. P(A|B) = P(A ∩ B) ÷ P(B).
2. For a normal distribution, what is P(X < μ)?
- 0
- 0.25
- 0.5
- 1
Show answer
C: 0.5. The distribution is symmetrical about the mean.
3. Approximately what percentage of normally distributed data lies within 2 standard deviations of the mean?
- 50%
- 68%
- 95%
- 99.9%
Show answer
C: 95%. About 95% falls within ±2σ.
4. What is the standardising formula for the normal distribution?
- Z = (X − μ) ÷ σ
- Z = X ÷ μ
- Z = μ − σ
- Z = (X + μ) ÷ σ
Show answer
A: Z = (X − μ) ÷ σ. This converts any normal variable to the standard normal.
5. Two events A and B are independent if:
- P(A|B) = P(A)
- P(A|B) = 0
- P(A ∩ B) = 0
- P(A) = P(B)
Show answer
A: P(A|B) = P(A). Knowing B has occurred doesn't change the probability of A.
6. P(A ∩ B) = 0.2 and P(B) = 0.5. What is P(A|B)?
- 0.1
- 0.4
- 0.7
- 0.25
Show answer
B: 0.4. 0.2 ÷ 0.5 = 0.4.
7. Approximately what percentage of normal data lies within 1 standard deviation of the mean?
- 50%
- 68%
- 95%
- 99%
Show answer
B: 68%. About two thirds of values.
8. X ~ N(50, 5²). What is the z-score of X = 60?
- 1
- 2
- 10
- 0.2
Show answer
B: 2. (60 − 50) ÷ 5 = 2.
9. Events A and B are independent with P(A) = 0.3 and P(B) = 0.6. What is P(A ∩ B)?
- 0.9
- 0.5
- 0.18
- 0.72
Show answer
C: 0.18. For independent events P(A ∩ B) = P(A) × P(B) = 0.3 × 0.6 = 0.18. Adding the probabilities (0.9) is a common error.
10. P(A) = 0.5, P(B) = 0.4 and P(A ∩ B) = 0.3. Which statement is correct?
- A and B are independent, because 0.3 < 0.4
- A and B are independent, because 0.3 < 0.5
- A and B are not independent, because 0.3 ≠ 0.5 × 0.4
- A and B are mutually exclusive, because P(A ∩ B) ≠ 0
Show answer
C: A and B are not independent, because 0.3 ≠ 0.5 × 0.4. Independence needs P(A ∩ B) = P(A)P(B) = 0.2. Since 0.3 ≠ 0.2 the events are not independent. They overlap, so they are not mutually exclusive either.
Keep going in Full Marks
Full Marks has 80 questions on Conditional probability and the normal distribution (70 more than here), set out in practice levels. You also get notes and 3D models for all 11 subtopics of Statistics, plus games, timed exams and past papers.
On your exam board
- AQATopic 10: Conditional probability, Topic 11: The normal distribution, Topic 12: Hypothesis testing: correlation and the normal distribution
- OCR ATopic 10: Conditional probability, Topic 11: The normal distribution, Topic 12: Hypothesis testing: correlation and the normal distribution
- OCR BTopic 10: Conditional probability, Topic 11: The normal distribution, Topic 12: Hypothesis testing: correlation and the normal distribution
- EdexcelTopic 10: Conditional probability, Topic 11: The normal distribution, Topic 12: Hypothesis testing: correlation and the normal distribution
- CambridgeTopic 6.1: The Poisson distribution, Topic 6.2: Linear combinations of random variables, Topic 6.3: Continuous random variables, Topic 6.4: Sampling and estimation, Topic 6.5: Hypothesis tests