A-level Maths Year 12 · Topic B
Statistics
Statistics at AS level is about collecting data well, summarising it clearly, and drawing sound conclusions.
We will look at sampling methods, the large data set, and measures of location and spread.
Then we use histograms, cumulative frequency and box plots, correlation and regression, and the binomial distribution with hypothesis testing.
- 11 subtopics
- 674 questions
- Free: B1 notes and 10 questions
In this topic
- B1Sampling, data and probabilityFree below · 74 questions
- B2Binomial distribution and hypothesis testingOpen in Full Marks · 62 questions
- B.3Population, census and sampling methods (simple random, systematic, stratified, quota, opportunity)Open in Full Marks · 64 questions
- B.4Working with the Large Data Set: context, cleaning data and identifying outliersOpen in Full Marks · 66 questions
- B.5Measures of location and spread: mean, median, quartiles, variance, standard deviation and codingOpen in Full Marks · 68 questions
- B.6Histograms, cumulative frequency graphs and box plots: drawing, interpreting and comparing distributionsOpen in Full Marks · 70 questions
- B.7Bivariate data: scatter diagrams, correlation and regression linesOpen in Full Marks · 70 questions
- B.8The binomial distribution: B(n, p), conditions and cumulative probabilitiesOpen in Full Marks · 56 questions
- B.9Hypothesis tests for a binomial proportion: critical regions, one- and two-tailed testsOpen in Full Marks · 47 questions
- B.10Permutations and combinations: arrangements, selections and restrictionsOpen in Full Marks · 53 questions
- B.11The normal distribution: standardising, using tables and the normal approximation to the binomialOpen in Full Marks · 44 questions
B1 · Free notes
Sampling, data and probability
Key points
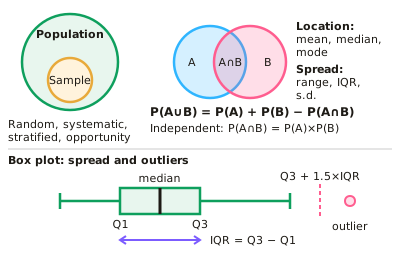
- A population is everything being studied; a sample is a subset. Random sampling gives every member an equal chance; other methods include systematic, stratified and opportunity sampling.
- Large data sets are summarised using measures of location (mean, median, mode) and spread (range, interquartile range, standard deviation).
- Outliers are commonly defined as more than 1.5 × IQR beyond the quartiles, or more than 2 standard deviations from the mean.
- Probability: P(A ∪ B) = P(A) + P(B) − P(A ∩ B); for independent events P(A ∩ B) = P(A) × P(B).
- Diagrams: box plots, cumulative frequency graphs and histograms help compare distributions.
In more detail
- Worked outlier test: Q1 = 30, Q3 = 42 → IQR = 12 → fences 30 − 18 = 12 and 42 + 18 = 60, so a value of 65 is an outlier.
- Worked two-standard-deviation rule: mean 50 and s.d. 6 → values below 38 or above 62 are outliers by this rule.
- Worked union: P(A) = 0.4, P(B) = 0.5, P(A ∩ B) = 0.2 → P(A ∪ B) = 0.4 + 0.5 − 0.2 = 0.7.
- Worked independence: 0.4 × 0.5 = 0.2 = P(A ∩ B), so A and B are independent; equivalently P(A | B) = 0.2 ÷ 0.5 = 0.4 = P(A).
Practice
Sampling, data and probability: 10 questions
Pick an answer to check it, or open the answer for the explanation.
1. What is random sampling?
- Choosing the easiest members to reach
- Every member of the population has an equal chance of selection
- Choosing every 10th member
- Grouping by category first
Show answer
B: Every member of the population has an equal chance of selection. This reduces bias in the sample.
2. Which measure of spread uses the middle 50% of the data?
- Range
- Interquartile range
- Standard deviation
- Mean
Show answer
B: Interquartile range. IQR = upper quartile − lower quartile.
3. For independent events, P(A ∩ B) equals:
- P(A) + P(B)
- P(A) × P(B)
- P(A) − P(B)
- P(A) ÷ P(B)
Show answer
B: P(A) × P(B). Independence means one event doesn't affect the other.
4. What is a common definition of an outlier?
- Any value above the mean
- A value more than 1.5 × IQR beyond a quartile
- The largest value always
- Any value below the median
Show answer
B: A value more than 1.5 × IQR beyond a quartile. Another common rule uses 2 standard deviations from the mean.
5. What does a stratified sample do?
- Ignores subgroups
- Samples subgroups in proportion to their size in the population
- Selects only volunteers
- Uses every member
Show answer
B: Samples subgroups in proportion to their size in the population. This makes the sample more representative.
6. Which sampling method divides the population into subgroups and samples each proportionally?
- Random
- Systematic
- Stratified
- Opportunity
Show answer
C: Stratified. This makes the sample more representative.
7. Which measure of spread uses every value in the data set?
- Range
- Interquartile range
- Standard deviation
- Mode
Show answer
C: Standard deviation. Standard deviation uses the distance of each value from the mean.
8. P(A) = 0.4, P(B) = 0.5 and A and B are independent. What is P(A ∩ B)?
- 0.9
- 0.2
- 0.1
- 0.45
Show answer
B: 0.2. 0.4 × 0.5 = 0.2.
9. A systematic sample of 40 students is taken from an ordered list of 600. What is the sampling interval?
- 10
- 20
- 40
- 15
Show answer
D: 15. Interval = population ÷ sample size = 600 ÷ 40 = 15. Pick a random start within the first 15, then every 15th student.
10. A school has 120 Year 12 and 180 Year 13 students. A stratified sample of 50 is taken. How many are from Year 12?
- 25
- 20
- 30
- 24
Show answer
B: 20. Year 12 share = 120/300 of 50 = 20. Stratified samples are proportional to each group's size, not equal across groups.
Keep going in Full Marks
Full Marks has 74 questions on Sampling, data and probability (64 more than here), set out in practice levels. You also get notes and 3D models for all 11 subtopics of Statistics, plus games, timed exams and past papers.
On your exam board
- AQATopic 10: Statistical sampling, Topic 11: Data presentation and interpretation, Topic 13: Statistical distributions, Topic 14: Statistical hypothesis testing
- OCR ATopic 10: Statistical sampling, Topic 11: Data presentation and interpretation, Topic 13: Statistical distributions, Topic 14: Statistical hypothesis testing
- OCR BTopic 10: Statistical sampling, Topic 11: Data presentation and interpretation, Topic 13: Statistical distributions, Topic 14: Statistical hypothesis testing
- EdexcelTopic 10: Statistical sampling, Topic 11: Data presentation and interpretation, Topic 13: Statistical distributions, Topic 14: Statistical hypothesis testing
- CambridgeTopic 5.1: Representation of data, Topic 5.2: Permutations and combinations, Topic 5.3: Probability, Topic 5.4: Discrete random variables, Topic 5.5: The normal distribution