A-level Economics Year 12 · Topic 3
Demand, supply and elasticity
This topic looks closely at how demand and supply work, and how responsive they are to change.
We will cover utility and the demand curve, price, income and cross elasticities, and price elasticity of supply.
Then we look at related markets, consumer and producer surplus, the price mechanism, and how changes in equilibrium reallocate resources.
- 8 subtopics
- 221 questions
- Free: 3.1 notes and 10 questions
In this topic
- 3.1Utility, diminishing marginal utility and the demand curveFree below · 30 questions
- 3.2Price elasticity of demand: calculation, determinants and total revenueOpen in Full Marks · 22 questions
- 3.3Income and cross elasticity of demandOpen in Full Marks · 23 questions
- 3.4Price elasticity of supply: calculation and determinantsOpen in Full Marks · 25 questions
- 3.5Joint, composite and derived demand; competitive supplyOpen in Full Marks · 31 questions
- 3.6Consumer and producer surplusOpen in Full Marks · 27 questions
- 3.7The price mechanism: rationing, signalling and incentive functionsOpen in Full Marks · 27 questions
- 3.8Changes in market equilibrium and the effects on price, quantity and resource allocationOpen in Full Marks · 36 questions
3.1 · Free notes
Utility, diminishing marginal utility and the demand curve
Key points
- Utility is the satisfaction or benefit a consumer gets from consuming a good or service. Economists use hypothetical units called 'utils' to illustrate it.
- Total utility (TU) is the total satisfaction from all units consumed. Marginal utility (MU) is the extra satisfaction from consuming one more unit: MU = ΔTU ÷ ΔQ.
- The law of diminishing marginal utility says that as more of a good is consumed in a given period, the MU of each additional unit eventually falls. TU rises at a decreasing rate, is at a maximum when MU = 0, and falls if MU becomes negative.
- A rational consumer aims to maximise utility. They buy extra units while the MU (valued in £) is at least the price, and stop where MU = price (marginal benefit = price paid).
- The equi-marginal principle: with several goods, utility is maximised when MUa/Pa = MUb/Pb. If MUa/Pa > MUb/Pb, the consumer should switch spending towards A until the ratios are equal.
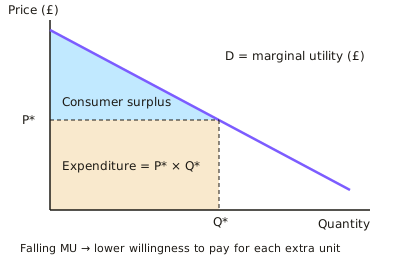
- The demand curve shows the quantity demanded at each price, ceteris paribus. It slopes downwards because MU falls with each extra unit, so consumers will only buy more at a lower price. The curve can be read as a marginal utility (willingness to pay) curve.
- Two further explanations for the downward slope are the substitution effect (the good is relatively cheaper than substitutes) and the income effect (a lower price raises real income and purchasing power).
- Distinguish an extension or contraction (a movement along D, caused only by a change in the good's own price) from a shift of D. Shifts are caused by changes in income, tastes, prices of substitutes and complements, population, advertising and credit availability.
- Consumer surplus is the difference between what consumers are willing to pay and what they actually pay. It is the area under the demand curve and above the price line. It rises when price falls.
- Market demand is the horizontal sum of individual demand curves (add quantities at each price). Evaluation: utility cannot be measured accurately. The theory assumes rational, well-informed consumers, and behavioural economics (habits, addiction, bounded rationality) challenges this.
In more detail
- Worked marginal utility: the first slice of pizza gives 20 utils, the second 14 and the third 6, so total utility after three slices is 40 utils and MU is diminishing.
- Worked equi-marginal principle: coffee gives 20 utils for £2 (10 per £) and cake 18 utils for £3 (6 per £), so the consumer gains by shifting spending towards coffee.
- Diamond–water paradox: water is essential but cheap because it is plentiful, so its marginal utility is low; diamonds are not essential but are scarce, so their marginal utility is high.
- Exam tip: explain the downward-sloping demand curve using diminishing marginal utility, plus the income and substitution effects.
Practice
Utility, diminishing marginal utility and the demand curve: 10 questions
Pick an answer to check it, or open the answer for the explanation.
1. Which definition of marginal utility is correct?
- The total satisfaction gained from consuming all units of a good
- The additional satisfaction gained from consuming one more unit of a good
- The price a consumer pays for the last unit consumed
- The average satisfaction gained per unit consumed
Show answer
B: The additional satisfaction gained from consuming one more unit of a good. Marginal utility is the extra satisfaction from one more unit (ΔTU ÷ ΔQ). Total utility is the sum for all units, and price is not a measure of satisfaction itself.
2. Total utility from consuming 1 to 5 units of a good is 10, 18, 24, 28 and 30 utils. What is the marginal utility of the fourth unit?
- 7 utils
- 4 utils
- 6 utils
- 28 utils
Show answer
B: 4 utils. MU of the 4th unit = TU(4) − TU(3) = 28 − 24 = 4 utils. 28 is the total utility, not the marginal utility.
3. A consumer's total utility from a good is at its maximum when marginal utility is:
- Zero
- At its highest value
- Equal to the price
- Negative
Show answer
A: Zero. TU keeps rising while MU is positive, peaks when MU = 0, and falls when MU is negative. The highest MU is at the first unit, where TU is still rising.
4. A consumer gets 12 utils from the last unit of A (price £3) and 10 utils from the last unit of B (price £5). To maximise utility she should:
- Make no change
- Buy more B and less A
- Buy more A and less B
- Buy only B
Show answer
C: Buy more A and less B. MU/P is 4 for A and 2 for B. A gives more utility per £, so switching spending to A raises total utility until the ratios are equal.
5. The marginal utility, in £, of successive units is £12, £9, £7, £5 and £3. The price is £6. How many units will a rational consumer buy?
- 2
- 5
- 3
- 4
Show answer
C: 3. Buy while MU ≥ price. The 3rd unit (£7) is worth more than £6, but the 4th (£5) is not, so 3 units are bought.
6. Which best explains why the demand curve for a normal good slopes downwards?
- Consumers' incomes fall when price falls
- Diminishing marginal utility means extra units are only worth buying at lower prices
- Higher prices always signal better quality
- Producers supply more at lower prices
Show answer
B: Diminishing marginal utility means extra units are only worth buying at lower prices. As MU falls with each extra unit, willingness to pay falls, so more is bought only at lower prices. Supply behaviour does not explain the slope of demand.
7. The price of a good falls, other things equal. What is the substitution effect?
- Consumers switch to inferior goods
- Consumers buy less because quality seems lower
- Consumers buy more because their real income has risen
- Consumers buy more because the good is now relatively cheaper than substitutes
Show answer
D: Consumers buy more because the good is now relatively cheaper than substitutes. The substitution effect is switching towards the now relatively cheaper good. Higher real income is the income effect.
8. A consumer would pay £8, £6 and £4 for the 1st, 2nd and 3rd unit of a good. The price is £4 and she buys 3 units. What is her consumer surplus?
- £6
- £4
- £18
- £12
Show answer
A: £6. Consumer surplus = (8 − 4) + (6 − 4) + (4 − 4) = £6. £18 is the total value she places on the three units, before subtracting what she pays.
9. Which would shift the demand curve for cinema tickets to the right?
- A fall in consumers' incomes
- A fall in the price of cinema tickets
- A rise in the price of popcorn bought at cinemas
- A rise in the price of streaming subscriptions
Show answer
D: A rise in the price of streaming subscriptions. Streaming is a substitute, so a rise in its price shifts cinema demand right. A change in the ticket price causes a movement along D, and the other two shift D left.
10. How is a market demand curve derived from individual demand curves?
- Using the demand curve of the largest consumer
- Averaging the prices individual consumers will pay
- Adding together the prices each consumer will pay for each quantity
- Adding together the quantities demanded by each consumer at each price
Show answer
D: Adding together the quantities demanded by each consumer at each price. Market demand is the horizontal summation of individual demand: at each price, add up the quantities demanded.
Keep going in Full Marks
Full Marks has 30 questions on Utility, diminishing marginal utility and the demand curve (20 more than here), set out in practice levels. You also get notes and 3D models for all 8 subtopics of Demand, supply and elasticity, plus games, timed exams and past papers.